
Hypothesis Testing
- Gowtham V

- Sep 13, 2023
- 4 min read
Hypothesis testing ascertains whether a particular assumption is true for the whole population. It is a statistical tool. It determines the validity of inference by evaluating sample data from the overall population. or
Attempts to refute a specific claim about the population parameter based on the sample data.
Hypothesis Testing Usually stated as:
Null hypothesis (H₀): The status quo (Condition that is doubted).
Alternate hypothesis (H₁): The challenge to the status quo (Condition that we believe in).

Examples:
* Null Hypothesis : Heart attack has no link with drinking alcohol.
* Alternate Hypothesis : Drinking alcohol increases the chances of heat attack.
Important Note.
* To reject null hypothesis is to conclude that it is false.
* To accept null hypothesis does not mean that it is true - It just indicates that we do not have enough evidence to believe otherwise.
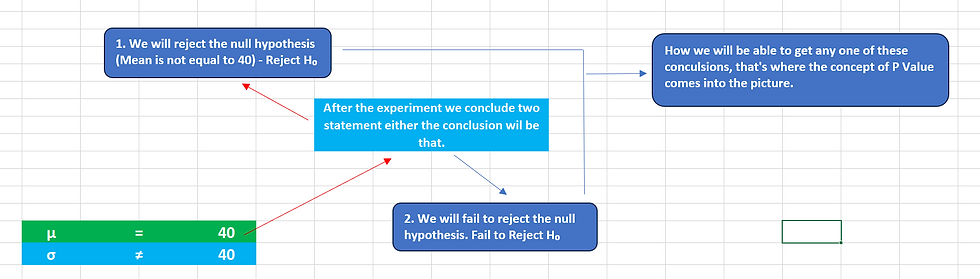
Thus, we either reject a hypothesis or we fail to reject it.
Type 1 & Type 2 Errors.

Null and Alternate Hypothesis. Steps in Hypothesis Testing
1. The first step of hypothesis testing is the formulation of the null and alternate hypotheses for a given situation.
2. Chose the level of significance.
3. Determine the rejection area.
4. Calculate the Test Statistics and compare it with critical value.
5. State the conclusion (Reject the Null Hypothesis/Fail to reject the Null Hypothesis).
Important Notes - 1. If your claim statement has words like “at least”, “at most”, “less than”, or “greater than”, you cannot formulate the null hypothesis just from the claim statement (because it’s not necessary that the claim is always about the status quo). We can use the following rule to formulate the null and alternate hypotheses:
The null hypothesis always has the following signs: = OR ≤ OR ≥
The alternate hypothesis always has the following signs: ≠ OR > OR <
For example: ABC claimed that its total valuation in December 2015 was at least $14 billion. Here, the claim contains ≥ sign (i.e. the at least sign), so the null hypothesis is the original claim.
The hypothesis in this case can be formulated as:

2. The formulation of the null and alternate hypotheses determines the type of the test and the position of the critical regions in the normal distribution.
The type of the test and the position of the critical region on the basis of the ‘sign’ in the alternate hypothesis.
≠ in H₁ → Two-tailed test → Rejection region on both sides of distribution < in H₁ → Lower-tailed test → Rejection region on left side of distribution
> in H₁ → Upper-tailed test → Rejection region on right side of distribution
ex: Suppose the XYZ company manufacturers a product which have a mean weight of 40. During inspection, the manager randomly choose 38 products and find sample weight is 44. Suppose Population standard deviation is 4. Use α = 0.05 Lets Define the Null (H₀) and Alternate Hypothesis (H₁). (H₀) = 40 (Mean weight of product is 40) (H₁) ≠ 40 (Mean weight of product is not equal to 40). Now, we need to conclude that whether the mean weight is 40 or ≠ 40?
μ = 40
Null Hypothesis : =40 Alternate Hypothesis : ≠40
Ans: Step 1: If the alternate hypothesis is written with a ≠ sign that means that we are going to perform a 2-tailed test because chances are it could be more than 40 or less than 40 which makes it 2-tailed. Here we divide (alpha or significance level) by 2. α = 0.05 α/2 = 0.025 --------------------------------------------------------------------------------------------------------------------------------------- Please Note - * First let's start with the meaning of a two-tailed test. If you are using a significance level of 0.05, a two-tailed test allots half of your alpha to testing the statistical significance in one direction and half of your alpha to testing statistical significance in the other direction. For this reason, the alpha level is divided in half (0.05/2 = 0.025). * level of Significance(α) : Level of Significance is basically defined as the area in the tails of the curve. Generally, level of significance is provided, but if it is not then we need to choose the level of significance. So, if the level of significance is not provided then we take it as 0.05 as it is the most common value. let’s see how that is represented in a 2-tailed test --------------------------------------------------------------------------------------------------------------------------------------- The area in blue is called the rejection region.

Step 2 - Find the Critical Value.
Critical Values are basically the z-value or t-value which separates the area shaded in red(area in the tail) and the middle area of the curve. ---------------------------------------------------------------------------------------------------------------------------------------
Please Note - Keep in mind that we will use the z-value when the population standard deviation(σ)is provided to us. We will use the t-value when: The population standard deviation(σ) is not given in the problem statement. The sample size taken or provided is less than 30.
---------------------------------------------------------------------------------------------------------------------------------------
Z critical value.
The critical value is Z 1-α/2 for a two sided test and Z 1-α for a one sided test. If the absolute value of the Z-value is greater than the critical value, you reject the null hypothesis. If it is not, you fail to reject the null hypothesis.
Zα/2 (Z Critical Value) = Z 0.025
1 - 0.025 = 0.975
Z critical value (Z 0.025) = 1.96.
I.E Reject H₀ if z < 1.96 or z > 1.96

Step 3 - Find the Test Statistic Test Statistic formula = Z = (x̅ – μ) / (σ /√n) where x-bar = average of the sample = 44 μ = average of the population = 40 σ = standard deviation of sample = 4 n = sample size = 38 z = (44-40)/(4/√38)
=6.24

Final Decision - Since z = 6.16 > 1.96 Reject the Null Hypothesis. (Population Mean weight of 40 is rejected, we have enough evidence to conclude that the mean weight has changed).


Comments